

This discussion walks us through the dynamics of personal economics so that you can plan and manage your finances at every stage of life. We will be focusing on practical advice you can use everyday. One of the most important things is to be able to afford the life of your choice, and know how to make it happen. It is imperative to know what it costs you to live and to prosper, where your incomes originate, and whether there is overflow or shortfalls in your current situation and in your plans for the future. The following table which is available to you for your personal use.
Personal Income Statement (Google Sheet)
The table identifies the average/median economic behavior of American households in 2022 (Bureau of Labor Statistics’ Consumer Expenditure Survey, and U.S. Census Bureau, Current Population Survey, 2022 and 2023) by category in US dollars and percentages, where they derive income and where they spend their money for home, travel, food, utilities, and pleasure.
• Average household earnings in 2022 were $94,003, while average total expenditures for the year were $72,967, according to the Bureau of Labor Statistics’ Consumer Expenditure Survey. This included an average of $24,298 on housing, $12,295 on transportation and $9,343 on food.
• The average monthly Social Security benefit for retired workers is $1,681 and is set to rise to $1,827 in 2023.
• 131.4M Wage earners incomes are: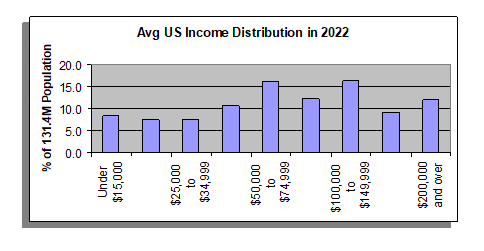
Consider national figures as rough benchmarks for evaluating what you do. In the income category wage earners drive $74,580/year while nonwage incomes (investments, retirees) add another $19,423/year in 2022. If you are a wage earner with a benefits package, the table will identify this indirect income which may total as much as 30% of gross salary for wage earners; but, you can’t easily spend this for everyday expenses. Expenses account for average home, travel, food, utilities, pleasure, and taxes. Net disposable income is income minus expenses or only about 5% of income.
You should run your own current income statement at your earliest convenience. To determine what you are doing and how it measures up to national averages, put your numbers in the column Your $s. If you use the online excel worksheet, the percentages will compute automatically. Be as thorough as you can with as much detail as you can; but even if you know only what you earned, borrowed, and were gifted and that you didn’t save anything left at year end, then you know something of value. The details of the worksheet let you get into where you are doing well, where you have challenges, and what to do next. You will want to be above national averages in income and below national averages in expenses.
The only way to change the economic realities is to either improve your income or decrease your expenses. For the mathematicians, I – E = Net Income, so you can only increase I, or decrease E, or preferably do both actions together. If you get promoted, change jobs, or receive an inheritance, then you have increased your income. Ideally, you might want spend 50% for essential, 30% for lifestyle, and 20% for savings and investments for the future. On a line item basis, housing is likely to be the biggest expense; so, if you follow the Pareto (80/20%) Rule, you should concentrate your expense reduction actions on the largest expense, then the next largest expense, and so on.
For those planning to retire,
- The 50-30-20 rule recommends putting 50% of your money toward needs, 30% toward wants, and 20% toward savings
- Aim to save at least 1x your salary by age 30, 3x by age 40, 6x by age 50, 8x by age 60, and 10x by age 67 (www.fidelity.com). A good rule of thumb is that your retirement income should equal about 80% of your pre-retirement income, says Steve Sexton, financial consultant and CEO of Sexton Advisory Group, a retirement-planning company.
- Follow the 4% rule. The first year you retire, the rule suggests you can withdraw up to 4% of your retirement savings. Then in the second year, you withdraw the 4% plus a cost-of-living adjustment, which is equal to the rate of inflation. This adjustment is made in each additional year and is added to the previous year’s withdrawal (www.fortune.com).
At first this may seem unnecessary, and if you haven’t yet got strong interests to pursue that will require resourcing, then you are right. It isn’t a tool for “the living in the now” set. However, if you have interests to pursue, a career to develop, a family to grow, or a retirement to enjoy, then fiscal discipline is integral to you achieving your goals. It can help with the now, but more importantly, it gives you at tool to set economic goals that will realize your objectives.
- For example let’s say you don’t earn enough Is it better to get a 10% raise from your current employer to do a side hustle or to change jobs at your company or leave the company for a 50% increase. The Pareto Rule would argue for the latter as a Strategic Inflection Point 50% might be worth your fear uncertainty and doubt FUD
- Are you saving 20% of income in accordance with the thumb rule? Should I spend less to invest more shuttle increased income to investments or do better with my employment benefits options and management? Probably all of the above. If you invest $15,000 (20% of 2022 $75,000 average income) at 5% per year return for 30 years, you net $64,82914 and all of that less $15,000 in interest income. Can you imagine what would happen if you did this or more every year during your wage earning years?
- What about expenses? If you live in an expensive environment where you have to work hard to make ends meet how about a transfer a new job in a better place, immigration, or a move to rural America? It could be strategic to your goals and it just might be fun!